Workers at risk of poverty are three times more than accounted for by the last Survey of the Salary Structure, the methodology of which excludes from the computation to 71% of those who perceive –in computing annual income is lower than the Minimum Interprofessional Wage.
The INE published the 25th of June the latest Wage Structure Survey (EES)[1], corresponding to 2012, and the media have highlighted some of their findings, among them a fall in the average wage and the increase in wage inequality, which particularly affects those who perceive wages below the Minimum Interprofessional Wage (SMI)[2]. This segment accounted for 8.8% of the wage-earning population in 2008 and in 2012 it reached 12.2%. Therefore, the results of the ESS indicate that during the crisis years the whole of the working class has decreased their income (deterioration of the average wage) and the increase in the segment of “working poor” (those who do not reach the SMI throughout the year). With concern these conclusions do not give proper account of reality; if we take into account the Statistics of Salaries of the State Tax Administration Agency, the strip of poor workers would be three times larger, reaching to the 32.9% of recipients of wage income in 2012.
How can we explain such a discrepancy between the two sources, both of an official character? Both stem from the same base (model 190 statements that companies fill out for the wages they pay) but, while the Statistics of the state tax administration agency includes all of the statements made throughout the year, the Wage Structure Survey is based on a sample, which had the effect of leaving out several categories of low-wage workers, raising artificially the average wage and image, giving it a much more watered down of the polarization in the wage. Operations methodological issues to which we allude, are basically the following:
- It does not include persons employed in the agriculture, livestock and fisheries (743.00 in 2012, according to the EPA, in their majority men) or domestic workers (653.450, most of them women). Both sectors with very low wages.
- Also does not include those who do not perceive wages in the month of October, besides being a necessary condition to enter the sample had worked at least another month of the same year (besides October). By this route left out a large number of recipients of wages that combine along the year periods of employment and unemployment (as a reference, in 2012 the four applications quarterly EPA collected an average of 2.7 million unemployed people who lost their jobs for less than a year).
- In addition, people who have not worked the entire year are assigned a perception equivalent to a continuous employment. For example, a person who has only worked two months (including October) and that has taken a thousand euros per month, reflected on the Survey as perceptora of 12,000 euros, and not 2,000.
As a result of these operations, the average wage of the EES is significantly higher (22.726 euros) than that of the AEAT (18.601 euros); in addition, the Wage Structure Survey invisibiliza, not only the sectors of agriculture and domestic service (1.4 million jobs), but a large part of the wage labor in a more precarious situation, that alternate along the year periods of employment and unemployment (around 2.5 million people).
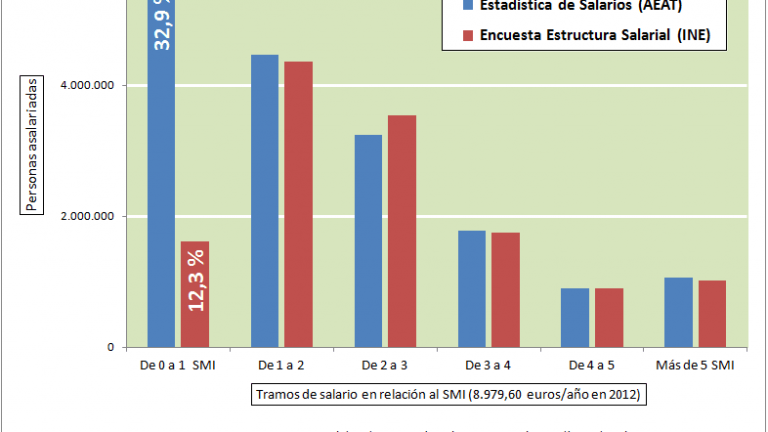
Figure 1 describes the distribution of salaries by sections in relationship to the Minimum Interprofessional Wage (SMI). It can be seen that the Wage Structure Survey excludes from the computation the total of 71.3% of those who earn below the SMI, while maintaining similar values in the remaining sections.
Figure 1. Polarization of wages in Spain in relation to the Minimum Interprofessional Wage (2012)

Half of the wage-earning population is paid less than a thousand euros
The social Barometer of Spain commonly uses the Statistics of Wages of the AEAT in order to know the wage inequality in Spain. Although this source is limited to the declared salaries (not including the underground economy), at least does not exclude the calculation to the categories that are most precarious and temporary of formal employment, as do Surveys of Wage Structure or of Labour Cost, both by the INE. Here we collect great traits, taking advantage of the information contained in the Barometer, how they have evolved in the last two decades the share capital and wages, and how these are distributed in 2012.
Between 1994 and 2007 the dollar value of the company shares, according to the Bank of Spain, grew up in an extraordinary way, going from 0.4 to 2.8 billion euros, at constant prices, which increased seven-fold its market price (rate year-on-year average of 16%)[3]. To reach the crisis, the shares have lost 30% of its value (830.000 euros in millions), but the pace of year-on-year losses in the five years of the crisis (6%) has been significantly less than the rate of profit in the fourteen previous years of growth (16%). The value of the set of companies in 2012 stood at the same level as in 2004, that is to say, they had lost considerably less than half of what was gained in the previous years.
In contrast, the average wage of the working population was nearly frozen between 1994 and 2007, advancing just 1.9% in the whole period. For its part, the wage bill (the total remuneration of the wage-earning population) grew by 81%, somewhat above the GDP (70%), due to the extraordinary increase in occupancy (from 12 to 20 million), with a rate of temporary employment three times higher than the average of the European Union for those years. Between 2007 and 2012, the wage bill (measured in constant euros) has been reduced by 19%. This decline could be attributed “merely” to the fall of employment; however, in parallel there has been a fall of 8% in the average real wage (in constant euros). In this way, the participation of wages in national income, which had declined continuously during the last cycle of growth, has become to fall with the adoption of policies of “adjustment” since 2010. In sum, it is perpetuating a structural trend to the redistribution down the income.
The polarization between high-wage and low has been very high throughout the study period but has increased significantly in the crisis phase. If in 2007 the wage-earners “rich” (perceptions above five times the Minimum Wage) received an income, or 17.6 times higher than the “poor” (perceptions below the SMI), in 2012 the difference increased to 18.9. The existing situation in 2012 (the latest year published) is shown in figure 2, which shows the magnitude of different segments of the wage-earners and of their respective income.
Figure 2. Differences in salary by segments in 2012

The lower stretch (less than a thousand euros/month) is formed by those who perceive wages in computing annual below 1.5 times the Minimum Interprofessional Salary (SMI), or less than 962 euros/month (the SMI was of 641 euros). Here is situated the 45% of the employees, to which must be added those who were in long-term unemployment (more than a year searching for employment) in 2012 was 3 million. If we include this group “employable” and job seeker –as defined by the EPA – in the global computing of the wage-earning population, the proportion of workers with a gross monthly income of less than thousand euros reached 50%.
The intermediate lengths (between one thousand and two thousand five hundred euros/month) are between 1.5 and 4 times the SMI; represent 43.6% of the population and constitute the mattress between the majority of low-income and the better paid.
The upper section (more than two thousand five hundred euros/month) includes 10% of wage-earners. In turn, at the apex of this segment highlights a minority of the 1% (just 0.8%) with wages above 10 times the SMI. In this group are located the 900 councillors and members of the senior management of the companies included in the Ibex 35 whose income means in 2013 were 54,000 euros a month. This is a social group formally wage-earner, but whose functions are the management of the companies representing directly the interests of their owners.
The data show the success of the strategy out of the crisis adopted by european elites and Spanish, the so-called “internal devaluation”, which passes through the impoverishment of the working population: on the one hand, by the decline of wage income and of the amount and rate of coverage of unemployment benefits; on the other, through cuts and privatization of public resources that affect the quality and universality of the policies of education, health, pensions, care dependency, social services, etc., But, in addition, the growing precariousness and social inequality need to be legitimated by a constant reference to the “out of the crisis”, which inflated the positive symptoms and blurs or directly distort the data more negative, as the extent of the casualisation of labour.
————-
Source: social Barometer of Spain (Colectivo Ioé)
[1] The Survey of Wage Structure is applied with the same methodology throughout the European Union with the aim of knowing the distribution of wages, what is not justified –in our opinion – leave out of the computation to various categories of wage employment that is precarious and eventually the incidence of which is particularly large in the case of Spain.
[2] The SMI fixed by the government for 2012 was 8.979,60 euros a year, equivalent to 641 euros per month in fourteen pay. An amount very close to the level of income that was used to determine the threshold of poverty that same year (8.321 euros/year, 594 euros/month in households of a single member, according to the Survey of living Conditions). Due to this proximity, it is considered under the threshold of poverty or “working poverty” to those who receive salary payments under the SMI.
[3] One of the factors that explain the growth and appreciation of the Spanish companies in this period was the investment of foreign capital that made Spain one of the countries with the largest private external debt in the world. According to data from the Bank of International Payments, between 2003 and 2008, the private external debt of Spain increased from 0.7 to 2.1 trillion dollars (in the same period, the public external debt increased from 0.2 to 0.3 trillion).