The economist Angus Maddison published the year 2007, a book Contours of the World Economy, culminating a task absolutely senseless to Attempt to measure the GDP per capita of various countries from the year 1 of our era. A mammoth task (in terms of data collection and analysis to make them comparable) that would produce inaccurate results and questionable (because it is difficult to be sure of, for example, the estimate of the GDP per capita of the Roman Empire in the age of Augustus). But at the same time of a utility impressive: they Are recurrent in story questions, in the end, are questions of standard of living (GDP per capita, harm than good, measured) and comparisons around it (how do you compare the prosperity of China, India and Europe in the FIFTEENTH century-XVI? to remember a well usual). As often happens, are those who dare to these tasks foolish that others do not that allow us to advance our understanding of the world.
From this was generated a project of multiple researchers, called the project Maddison in honor of the researcher (deceased 2010). The project has published a database for historical comparison, and a few months ago in this 2018 published its most recent update (see here link). The database has data for Chile from the year 1810 onwards, so that this allows a look of long-term economic growth in Chile.
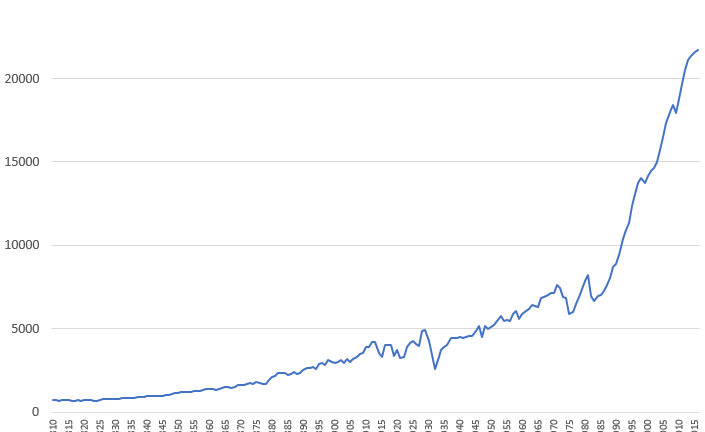
For the comparison of growth over time, the project recommends the use of the table rgdpanpc (which corresponds to GDP real per capita in us dollars of 2011, with benchmark year 2011), and is the one we will use for our first two graphs, which try to show the growth of the economy of Chile in the couple of centuries of our republican history.
Per Capita income, Chile 1810-2016 (dollars of 2011)

The data are quite clear in showing a change in the pace of permanent growth of around 1985-1990. The increase in the GDP per capita from those years, experiencing a leap that clearly is very different from the previous trend. I have there a discontinuity. The phrase is so hackneyed of a Chile really changed in the last few decades has a correlate very clear in that graph.
Now, someone could retrucar a graph showing absolute values can be misleading: A growth of 5% implies a jump very different when you have an income of 1000 that when you have 20,000, and it is this that might appear in the chart more than a fundamental turnaround. This is correct, but leaves out two elements that are relevant: (1) does Not always appear that change of trend in the graph all (if you do the same chart for Argentina do not find this change) and (2) yes, it is very different, which implies a growth of a certain level at very different levels of income, that is also something to highlight.
As all ways it is a relevant issue, we proceed to then show a graph of the percentage of growth. Now, if you made a chart of annual you do not find any trend that can be described, but if you made a graph of decadal growth if it appears something very interesting.
Percentage decadal growth of per capita Income, Chile 1816-2016 (dollars of 2011)

And then it is clear that there is indeed a leap in the decade from 1986 to 1996 (if used decades initiated in other years will be blurred the most, but the phenomenon of all forms is clear). The rate of decadal growth is not only the highest of the entire republican history, but that it far exceeds (more than double) to any other decade. It is clear that it is there, and only there, where there was a jump. The subsequent decades have levels that, within the historical trends, are at a high level but within normal. It is true that having three decades of growth (four if you consider also the 1976 and 1986), with levels of growth that are not low to our historical trend, is also something exceptional -normal is more good decades followed by decades more of low-, but in terms of decades between 1986 and 1996, where it produced a qualitative leap.
As good part are not interested in the descriptions without have to be accompanied by assessments, or at least its effects for evaluation, then you will have to remember the following: it Is a fact that, like us or not, it is under the current model of development that (a) Chile experienced its decade high growth in its entire history, and (b) a few decades, also looks set represent the period of greatest growth. Stated another way, in terms of decades we have not had a decade of loss from the ’80s (the decade 1974 to 1984 implies a growth of 1.7% and is the last occasion that this happens, just coming out of a recession extremely strong). You can say many things about it, since it was not a dictatorship but under the Conclusion (and therefore under a model that would not be the same) that have obtained the best results, or that not everything is growth (from distribution -few are those who enjoy that growth – up to matters non-economic); but the data are undeniable, and whatever your assessment and posture there is no other to take them. In terms of growth, the period Buchi-Foxley is, without comparison, the best of our history.
Now, all of this was looking at only to Chile. But clearly to evaluate the economic performance not just look at the growth itself. In the end, the fact that it is not observed in the chilean case the ‘3o glorious’ of the developed countries (high levels of growth in post-war) does not cease to be quite relevant. To observe the ‘convergence’ (or divergence) of Chile with the developed countries, you will see a percentage that represents the entry of Chile to the united States. This has always been a rich country in comparative terms, and close to or directly in the line of the frontier of productivity -that is, the country that produces more efficiently given the technology at a given time. I thought I’d compare with the country of maximum income -as the equivalent of frontier of productivity-but, in that case appeared in a small oil-rich countries (Qatar, Uae) with numbers very high, that did not involve border of productivity, and the exercise of removing countries strangers do not let be subjective (what do I include Norway, with the oil and its revenue by the fund for the public investment?). Given that, the best to compare with the united States.
The data for this comparison come from the same base, but now the table cgdppc (also, the per capita income of us GDP in dollars of 2011, but here based on benchmarks multiple, that us the authors say serves for the comparison of income between countries).
Percentage of income per capita of Chile compared to the us.UU 1810-2016

What we find is that Chile has experienced convergence with the united States in recent decades. However, we still haven’t reached the figures of the second half of the TWENTIETH century, and it is not only results that he chose the united States as a comparison. There are several developed countries with which the comparison in, for example, 1883 gives a greater convergence that the 2016: France (income chilean being the 65% of the French in 1883 and 55% in the 2016) Germany (66% and 46% respectively), the Netherlands (55% and 44%). In other cases, such as Portugal or Italy, the income chilean 1883 was higher than that of the respective countries on that date. Not always the case (compared with the Uk, the income chilean converges more now), but one conclusion is clear: it is Not true that the contemporary period is when most near Chile has been found in developed countries.
The qualitative leap of development that we saw earlier has brought us closer to the developed countries, but has not yet achieved the status of convergence from the mid-NINETEENTH century. How do you do this? The answer is clear: Because in the 40 years between the 1940s and the 1980s, Chile moved away progressively from the developed countries. Although in terms of decadal growth does not seem to be decades very different to the previous ones, it happens that this is a period of very high growth of the world economy -and therefore the economic performance of Chile is comparatively poor. The years of developmentalism, then, were not -from the point of view of economic growth – good years.
In fact, one can note that the times in which Chile has converged with the developed countries have been periods of relatively liberal in economic matters -the end of the NINETEENTH century, the parliamentary republic, the current model. Again, this is not to say anything about evaluations (can be retrucar that the trajectory of convergence reached a maximum and no progress was made more, or is that not accounting for the leap, that the performance later of the development is explained by the problems that failed to solve the previous model etc); but the case is that the phrase with which you started the paragraph does not cease to be correct.
Beyond all the discussions that can produce these data, there is something that is very clear. Throughout the 200 years of republican life, there is only a jump and change in trend in the growth of income (and in the end, in the standard of living) for the whole period. The decade from 1986 to 1996 -that is where the change occurs main.