1. Introduction
One of the possible consequences that have been discussed about the fact of having choice with voluntary voting is the bias socio-economic: That communities with lower socio-economic level had more abstention (for example, see the following article for Contreras and Morales). Which in turn was denied by others or relativized by others, and Valenzuela). In all of this has called me powerfully the attention that there is a greater concern for potential bias is strictly political voluntary voting.
Here one can compare with attrition in surveys (which is equivalent to the fact of abstaining from a vote). According to the most classic of the distinctions there are three basic processes of attrition: One is that it is completely random (which is equivalent to propose that the abstention is partner to all segments). Another is that it is associated with another dimension but not to what we want to measure. Let’s say, I want to measure income, but the men answer less than women. Now as the fact of bias is not associated with income, then the men answering with the same income than those who do not answer. This is equivalent to assume that the bias is only of socio-economic level, but within the same socio-economic level of those who vote are equal to those who do not vote. It is the hypothesis of those who maintain that had there been compulsory voting (and then higher participation rates in the communes popular where Bachelet won in the first round by large majorities) there would have been no second round: Those votes, ‘lost’ would have behaved like that were to vote.
The hypothesis more complex is the third type of attrition; When the process that produces attrition is associated to the variable that I want to measure: I want to know income, but an income group has a lower willingness to participate. This is equivalent to the fact that the bias poll is associated with political positions. That is the hypothesis that we will try to explore here.
Explore because with aggregate data to draw conclusions about people you have the risk of the fallacy ecological. But of all forms serves as a first exercise. Now, since there is the idea that there is a bias in the socio-economic, so the idea is to observe both dimensions.
2. The data
To do this we created a database with the 34 communes of the Great Santiago. Why? Because of the Large Santiago is segregated socioeconomically, by which a commune of the high-income is made up in good part by high-income earners; and a community of low income is composed by low-income people. In communes mixed -as is a good part of the rest of the country (where, in the same commune living people of high and low-income)- the differences in income between communes divided less among people of high and low-income. It is a form, small, to limit the risk of fallacy ecological.
Given that we are interested to see what is happening socio-economically, then we need a variable to do this. Was chosen as a variable to the entry independent of the average household by commune as it appears in the MARRY 2011. I thought occupy poverty level -as is done in other analyses – but checking the data, and recalling the limitations of the MARRY for estimates in small populations, the data of income gave results more ‘sensible’ (for example, by poverty level, Lo Barnechea is not in the communes of high income).
How and electoral behavior? To measure the political impact I suppose that it is proper to observe as it has evolved the vote of the Consultation and the New Majority, and compare it with the right. To do this, and to compare like with like, is removed from the site of the SERVEL the data of the elections in 2nd round of 1999, 2005, 2009 and 2013. And in every election we generated a data for the right candidate and another for the candidate of the Concertación.
Then, we proceeded to establish the differences: The difference between the vote in 2013 and 2009 and, given that 2009 is not perhaps the best basis of comparison, also the difference between the vote in 2013 and the average vote 2000-2009. As this operation is performed for the Conclusion-NM and to the Right it is possible to establish the percentage of decrease of each coalition for each commune.
Why not use the fact of abstention? First, because in between is the change of register, for a comparison between elections makes it unviable -at least for a quick exercise – get and compare levels of abstention.
The base -modest, if at all available here.
3. The results
The first is what is already relatively well known: The decrease is much stronger in the right, and this applies both in relation to 2009 as the average for 2000-2009. The averages of all the communes in the following table:
| Coalition | Comparing 2013 with 2009 | Comparison of 2013 with average 2000-2009 |
| Conclusion-NM | 0,7% | Or-10.8% |
| Right | -37,9% | -35,5% |
So, in the first instance, we can say that the voluntary voting affects the position more than the other.
But more relevant, and more interesting, is to observe the relationship with the socio-economic level. In the end, if we know that the communities of higher income have lower abstention and are at the same time you vote for more for the right, there is apparently an interesting phenomenon to explore.
Given that this is a quick exercise, simply place the R2 (and the sign) of the relationship between the Income to MARRY 2011 and the changes in the voting at the communal level by the coalition. We first present the data for all the counties:
| Coalition | R2 Income -> Difference 2013 with 2009 | Sign regression | R2 Income -> Difference 2013 with average 2000-2009 | Sign regression |
| Conclusion-NM | 7,7% | Negative | 1,3% | Negative |
| Right | 72,6% | Positive | 56.1 per cent | Positive |
As we can observe in the case of the Conclusion-NM there is no greater relationship: The percentage of variation does not change largely according to the level of income of the commune. The little impact that there is negative: higher income decreases the vote
In the case of the Right the relationship is quite strong (56.1 per cent R2 between income and variation 2000-2009 against 2013). And the relationship is positive: In the communes of lower income, the fall in voting is much higher
But it happens that Vitacura has an income much greater than the rest that for a linear regression makes sense to make the same comparisons without Vitacura (*)
| Coalition | R2 Income -> Difference 2013 with 2009 | Sign regression | R2 Income -> Difference 2013 with average 2000-2009 | Sign regression |
| Conclusion-NM | 2,5% | Negative | 0,2% | Positive |
| Right | 76.7 per cent | Positive | 57,0% | Positive |
And we can observe that, even removing the outlier, the conclusions are the same. In fact, the only thing that happens is that with the Conclusion-NM the relationship is non-existent, while in the case of the Right is maintained.
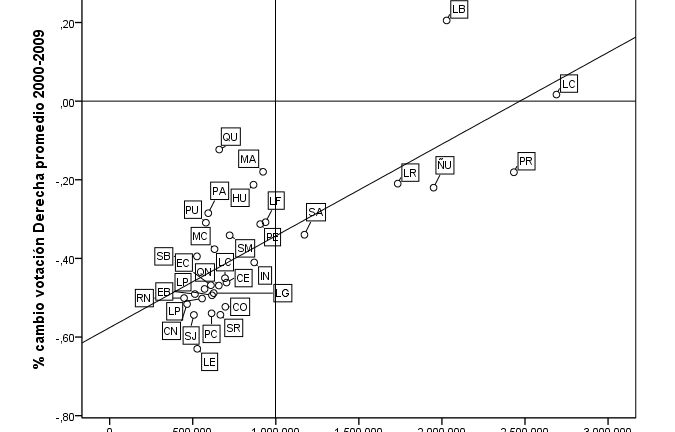
Perhaps the situation of the right is more clear in the following graph (in which we choose the analysis without Vitacura and comparing difference voting 2013 with average 2000-2009)

The reduction of the vote is clearly stronger in municipalities of more low-income, and it is in the communes of high-income we are able to observe a positive variation (Las Condes and Lo Barnechea in the communes that remained in the analysis) or of less magnitude.
The regression analysis has several advantages, but also disadvantages. One of them is to advocate for a linear relationship when it is not always perhaps that is the best way. To make it simple, the life will present a table that summarizes the variances of the votes for the income levels of the communities for groups (by quintiles of communes)
| Quintile | Communes | % change vote NM average 2000-2009 | % change vote Right average 2000-2009 |
| Quintile 5 | VI, LC, PR, LB, WILDEBEEST, LR | 13.4% from | -6,0% |
| Quintile 4 | SA, LF, MA, PE, IN, HU, SM | -5,4% | -30,1% |
| Quintile 3 | CE, CO, LC, SR, QU, QN, MC | -12,7% | -42,1% |
| Quintile 2 | LG, LP, PC, EC, PA, PU, RE | -10,3% | -43,7% |
| Quintile 1 | LP, LE, SB, EB, SJ, CR, RE | -12,8% | -51,1% |
As we can see, in the communes of lower income, the right drop is of greater magnitude (the effect also occurs if one makes the comparison only with 2009, but it is of lesser magnitude, and divides rather Quintile 1 / Quintile 2 / Quintile 3 to 5). While in the Conclusion-NM is relatively more even.
In other words, not only there seems to be a political bias in the changes produced by the voluntary voting, but that this bias seems to have some relationship with the socio-economic level: they were Not the poor in general those who no longer vote, but in particular the poor of right.
In other words, if those people had gone to vote no is Bachelet who would have received those votes. Who was to vote seems to be different from who there was to vote.
4. Small Discussion
The exercise is gross and all but I think that illustrates that it makes sense to explore other biases beyond the socio-economic. Do not let be reasonable that there be political biases as an effect of voluntary voting. This is because the right and left have different relationships with the policy.
The left is, finally, pro-policy, believes that it is an activity valuable, and that, in the best of cases, can become noble. It is a position that you create as a solution of the problems in the collective construction of public, in other words they believed that through politics is how you can improve the life.
The right, on the other hand, is anti-political suspicion of it and what it can do, and the good society is where there is less government and collective activity. In the best cases, the policy can not do all the evil they can do, and the work of the political right is the necessary, but ungrateful task to avoid those problems. While less political, the better.
In these conditions it is not unlikely that the voter of the right to vote except when it is voluntary to do so. And less strange is that the voter popular right -the person who meets the two conditions that make it shy away from the policy, the lower level of socio-economic and political position – is the person who less vote. For a voter, whose vision of the policy can be illustrated by the saying of ‘for what to vote if tomorrow as I have to go to work’ take advantage of the opportunity not to vote is what makes the most sense.
The above analysis is, by the way, valid for these elections. Once the political actors internalized strategies for engaging with the voluntary voting other things will happen. But at least in these elections, the voter that was not represented was the popular vote of right-of UDI popular if you want to search for a specific image.
(*) Stating that, in general, does not have much sense for us to remove for an analysis of the relationship between Socioeconomic status and Voting the communes of higher incomes: Because if we remove them, we remove a good part of the people of higher income; and given the concentration of income is in that part of the distribution where it is produced as the major differences. It is known that the deciles of lower incomes have averages similar, and it is only in the higher-income -and in particular in the more revenue – which produces the difference. Remove the communes of greater income is to eliminate the segment of reality where the effect occurs. But in this case, at least make an analysis without Vitacura may make sense.